Find Invisible Primes™ – Trust Science’s Canadian Installment Six°Score™ provides industry-leading accuracy tailored to the non-prime market. Leveraging the CreditBureau+™ platform, the Canadian InstallmentSix°Score™ harnesses the power of machine learning and explainable artificial intelligence and combines the credit file with consumer-consented banking data for an unparalleled predictiveness and 360° risk view of more applicants. Clients get vastly improved business performance, double-digit ROI, and more financially inclusive lending, backed by data-driven insights that enable you to swap out bad deals while swapping in good ones.
1
Score Overview and Model Validation
2
Head-to-Head Comparison
3
Deep Subprime Performance
4
Dual-Score Matrix
5
Swap Set Identification
Score Overview and Model Validation
Score Overview
The Canadian Installment Six°Score™ was built on thousands of records in the Canadian subprime market, creating a highly focused and highly predictive model.
Model Validation
The Canadian Installment Six°Score™ offers strong statistical performance across all predictiveness and good/bad separation metrics. Validation completed on an analysis of thousands of booked subprime loans.
Kolmogorov-Smirnov (KS) Test Results
KS represents a model’s ability to differentiate good and bad populations. Six°Score™ returned a KS result of 36.85, highlighting its power at its most predictive.
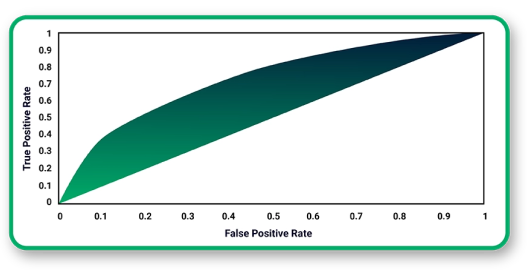
AUC-ROC Results
ROC signifies the diagnostic ability of a model. Six°Score™ returned an AUC-ROC result of 0.751, highlighting its predictive power across its score range.
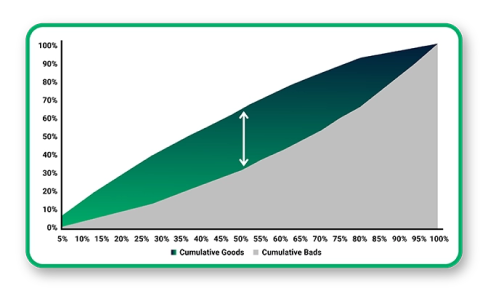
Gini & Lorenz Curve
The Lorenz curve and Gini coefficient measure a model’s ability to capture bad loans in lower score tiers. Six°Score™ had a Gini coefficient of 0.5048, proving its bad capture abilities.
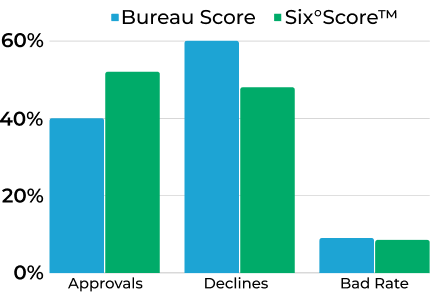
Client Validation: Head-to-Head Analysis
Trust Science prepared a validation study on one client that ran the Canadian Installment Six°Score™ in parallel with a conventional bureau score. Across all metrics of performance, the Six°Score™ vastly outperformed the bureau score. The test window ran on thousands of subprime loans booked from Q1 2022 to Q1 2023.
Statistical Lift
KS Lift
0%
Six°Score™ differentiates between good and bad loans with significantly greater accuracy vs. a common bureau score.
Gini Lift
0%
Six°Score™ rank orders better, capturing more bad loans in low score bands vs. a common bureau score.
ROC Lift
0%
Six°Score™ has overall superior good and bad classification, with less error vs. a common bureau score.
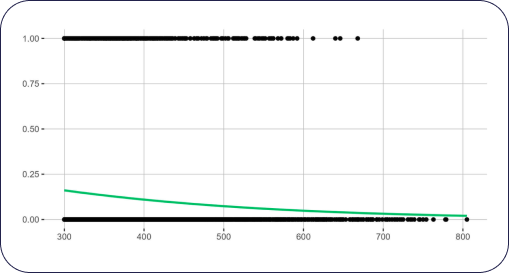
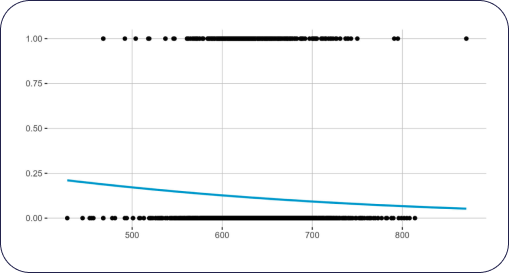
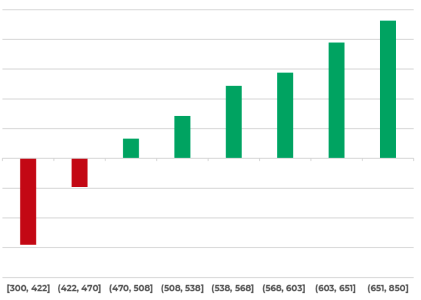
Regression & Distribution
Visual analysis of the logistic regression plot highlights Six°Score™’s ability to densely classify bad borrowers at the bottom of the scoring range and avoid incorrectly classifying bad borrowers on the upper end of the range. Comparatively, the bureau score concentrates both good and bad in the centre of the distribution with limited separation.
Six°Score™
Bureau Score
Deep Subprime Population Comparison
While the bureau score had minimal differentiation power between good and bad loans, Trust Science offered successful risk rank-ordering even in this tier by providing a 360° view of the consumer. Six°Score™ enables you to approve more underserved borrowers in this range with confidence. Six°Score™ vastly outperformed the bureau score with the following:
KS Lift
0%
Gini Lift
0%
ROC Lift
0%
Dual-Score Comparison Matrix
In a dual-score matrix generated from the analysis of thousands of approved loans, the records were scored by both the Six°Score™ and a traditional credit bureau. Scores from both sources were divided into quintiles based on the population, allowing for a performance comparison.
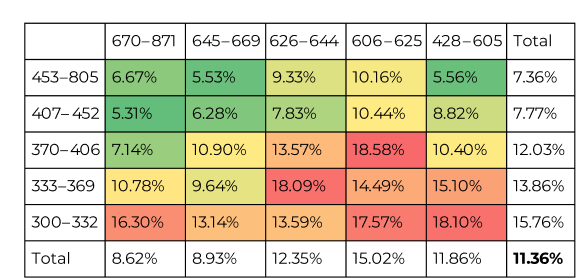
Default Rate Matrix
Six°Score™ reveals InvisiblePrime™ borrowers missed by conventional bureaus, & correctly identifies bad borrowers that would typically otherwise be approved by the bureaus. Loans scored in the bottom 20% of the Bureau Score yet scored in the upper 40% of Six°Score™ exhibited a lower rate of default. Conversely, those scored in the upper 20% of the bureau score but in the lower 20% of Six°Score™ exhibited a substantially higher rate of default. Additionally, there is a benefit in applying a dual-score approach for further lift.
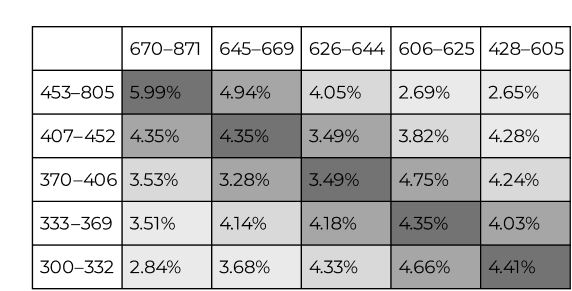
Distribution Matrix
Six°Score™ is able to identify significant swap sets providing material opportunities to boost return on assets and improve overall portfolio performance.
Swap-In Analysis - Client A
Trust Science was tasked with increasing one client’s approvals while retaining the same bad rate. By providing a more comprehensive view of the consumer’s risk (on the same sample evaluated above), Trust Science was successfully able to identify two tiers of loans that were declined but profitable.
By swapping in a set of loans that scored in the bottom 20% of the bureau score (less than 605) but also scored in the top 40% of Six°Score™ (greater than 407), Trust Science approved 10.4% more consumers that were previously rejected, reducing the bad rate by 0.4% and improving earnings by 25.5%.
Swap-Out Analysis - Client B
Trust Science was tasked with reducing another client’s defaults. While running the Six°Score™ in parallel with the conventional bureau score, Trust Science found that two tiers of loans were being approved that were unprofitable.
By rejecting the bottom 25% of loans as adjudicated by the Six°Score™, Trust Science could eliminate 44.6% of bad loans. As a result of rejecting these bad tiers, Trust Science increased earnings by 31.9% and improved return on capital by 75.9%.